[racket-dev] New plot library pushed
I ported all of the science collection graphics to use the new plot package.
It was relatively painless. Most of the effort was actually in improving my
graphics using some of the new options - like adding labels for legends.
Also, there are many places with the old plot package where I had to fudge
things like #:x-min and #x-max - like #:x-min 0.001 instead of #:x-min 0.0 -
because the graphics package itself was very unforgiving of it's internal
numeric errors. Neil's seems to be much more robust and forgiving.
[Obviously I still need to do it in some cases where there would be contract
violations on functions being plotted.]
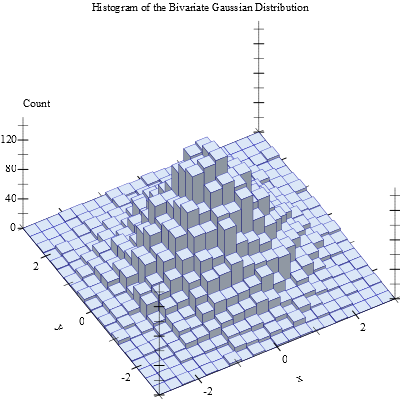
I used the rectangles and rectangles3d renderers to make my continuous
histogram plots and the discrete-histogram renderer to make my discrete
histogram plots. The discrete-histogram renderer was also good for the
plotting the discrete functions in general.
The graphics looks much better and, since I had encapsulated all of the
graphics routines from the start, no user code using them needs to change.
I am removing my plot extensions from the science collection. I don't think
they would even work with your compatibility module. I doubt that anyone
other than me ever used them anyway, but it is possible.
I will test it on all of my platforms over the next few days. [I did all of
this on one of my Windows 7 computers using the 64-bit version of the 5.2
pre-release version (5.1.900.1)].
Neil, thanks for the good work.
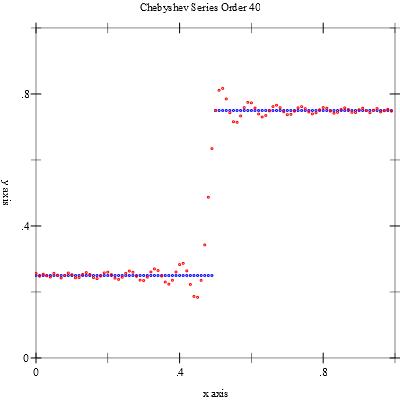
I've attached a couple of example plots from the science collection.
Doug
On Wed, Oct 5, 2011 at 2:47 PM, Neil Toronto <neil.toronto at gmail.com> wrote:
> On 10/05/2011 02:07 PM, Robby Findler wrote:
>
>> Looks like I spoke too quickly. I think I'm actually not going to be
>> much help with this.
>>
>> In particular, I don't know what mix does and I can't figure out from
>> the docs, so I don't know what it means to replace 'mix' with 'list'.
>> I can try again if you want, but maybe it is easier for you if you
>> just do it. If not, I'm happy to help with whatever tasks you think
>> I'd be useful for.
>>
>
> The old 'plot' and 'plot3d' took a procedure with the contract
> (some-drawing-area -> void?), which was meant to draw the plot. The 'mix'
> function composes them.
>
> I'm not asking you to try again. It's more efficient for everyone if I do
> the porting page anyway. Besides, adding a porting page will allow me to
> solve some minor organizational problems in the docs as they are.
>
> Thanks for wanting to help with that.
>
> I thought of a task you'd "be useful for". If it's not too much trouble,
> could you compile your papers with the plots in them and see what breaks?
>
> Neil T
>
> ______________________________**___________________
> For list-related administrative tasks:
> http://lists.racket-lang.org/**listinfo/dev<http://lists.racket-lang.org/listinfo/dev>
>
-------------- next part --------------
An HTML attachment was scrubbed...
URL: <http://lists.racket-lang.org/dev/archive/attachments/20111009/cf9f554d/attachment.html>
-------------- next part --------------
A non-text attachment was scrubbed...
Name: bivariate-gaussian-histogram.png
Type: image/png
Size: 84762 bytes
Desc: not available
URL: <http://lists.racket-lang.org/dev/archive/attachments/20111009/cf9f554d/attachment.png>
-------------- next part --------------
A non-text attachment was scrubbed...
Name: Chebyshev-Example-Order-40.png
Type: image/png
Size: 11719 bytes
Desc: not available
URL: <http://lists.racket-lang.org/dev/archive/attachments/20111009/cf9f554d/attachment-0001.png>