FW: [plt-scheme] Statistics (V301.5 Speed Up)
Actually, this exercise is very much a "plug and chug" endeavor on my part.
I am just curious - in a wholly unscientific way - about the speed up from
V301 to V301.5 for a continuation entensive application. In this case, the
application domain is models developed using the simulation collection I
developed. It was meant as a thanks for the work that went into the
run-time improvements and as I way that I could guage for myself some
measure of the speed up. I am quite satisfied with simple statistics on the
results - the only variable between runs of the same model has been the
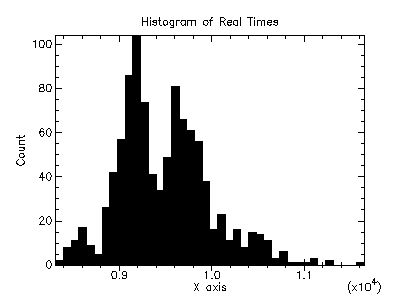
version of the PLT Scheme system used. Some of us were also curious about
the shape of the distributions of run times - another example of which is
attached here.
If anyone would like to do some statistically meaningful ananysis on the
data. All of the code is available on PLaneT.
Doug
-----Original Message-----
From: Matt Jadud [mailto:mcj4 at kent.ac.uk]
Sent: Sat 2/11/2006 1:15 AM
To: Williams, M. Douglas
Cc: plt-scheme at list.cs.brown.edu
Subject: Re: FW: [plt-scheme] Statistics (V301.5 Speed Up)
Statistics is not a "plug-n-chug" endeavor. One of my favorite resources
to date on exploratory data analysis comes from NIST:
http://www.itl.nist.gov/div898/handbook/eda/eda.htm
I also liked Trisha Greenhalgh's "How to read a paper: The basics of
evidence-based medicine", a book (surprise!) on interpreting reports and
results in the area of evidence-based medicine. The full text seems to
be available here:
http://bmj.bmjjournals.com/collections/read.shtml
and the two articles "Statistics for the non-statistician" and
"Statistics for the non-statistician II" are good; the remainder of the
book requires some interpretation to apply out of context, but it is
still a good resource while performing EDA on unknown datasets.
http://bmj.bmjjournals.com/cgi/content/full/315/7104/364
http://bmj.bmjjournals.com/cgi/content/full/315/7105/422
Sadly, I can't join further in the First International Scheme Contest
for One Statistical Beer, as I need to take off for parts uknown for the
day.
*sigh*
No free beer for me.
M
Williams, M. Douglas wrote:
> I ran 1000 runs and made a histogram of the results. Unfortunately, there
> is one value out at 16353 while the others were between about 6000 and
8000.
> Which made the histogram difficult to interpret. I have attached the code
> and the resulting histogram.
-------------- next part --------------
A non-text attachment was scrubbed...
Name: histogram.jpg
Type: image/jpeg
Size: 13948 bytes
Desc: not available
URL: <http://lists.racket-lang.org/users/archive/attachments/20060211/f0059aa5/attachment.jpg>